KY Community Banks Gain Share
KENTUCKY Headquartered Community Banks Dominate the Deposit Growth for the State over the Super Regionals
The FDIC recently released its latest figures on bank deposits and market share as of June 30, 2016. Banks are required to provide regulators with branch deposit numbers for their offices as of June 30 each year.
Those numbers indicate that there are 190 banks and 1,689 bank offices in the state with total deposits of $76,529,871,000. The number of banks declined by six and the number of offices has declined by 12 from the prior year however deposits have increased a total of $1.8 billion or 2.41%. As an aside, of the 190 banks in the state, 46 or 24% have federal charters while 144 or 76% are state chartered.
|
KY Based Banks vs. Non-KY Based Banks |
KY Based |
Non-KY Based |
|
# of Banks |
165 |
25 |
|
# of Offices |
1,054 |
635 |
|
$ Deposits |
43,361,164 |
33,168,707 |
|
Market Share |
56.69% |
43.31% |
|
$ Growth over Prior Year |
1,522,450 |
280,704 |
|
% Growth over Prior Year |
3.64% |
0.85% |
|
|
|
|
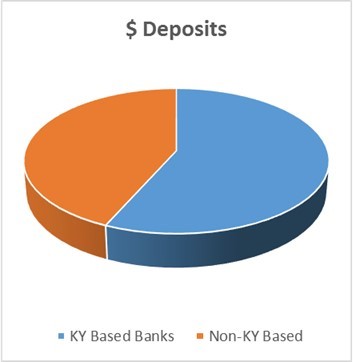
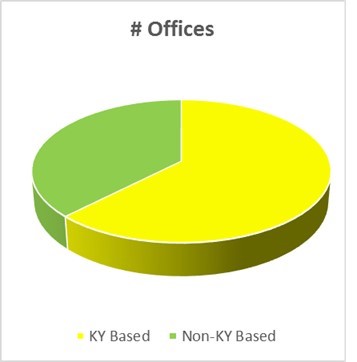
Kentucky based banks (those that are headquartered within the Commonwealth) make up 87% in number while those from outside the state total 13%. Offices of those Kentucky based banks total 62% while those non-KY based banks make up 38% of the offices in the state. However, the market share of KY based banks compared to the others illustrates a slight advantage with the KY based banks controlling 56.69% of the market. Interestingly, the most telling statistic was that the locally headquartered community banks outgrew the out of state super regional banks by a ratio of 5.4 to 1 or a little over 4 to 1 on a percentage basis.
|
Top 5 Banks in KY Ranked by KY Deposits |
$ Deposits |
Mkt. Share |
Offices |
|
PNC Bank |
7,371,275 |
9.63% |
100 |
|
Branch Banking & Trust Company |
6,271,885 |
8.20% |
112 |
|
JPMorgan Chase Bank |
5,667,540 |
7.41% |
62 |
|
Fifth Third Bank |
5,559,512 |
7.26% |
93 |
|
U.S. Bank |
4,039,476 |
5.28% |
127 |
|
|
|
|
|
|
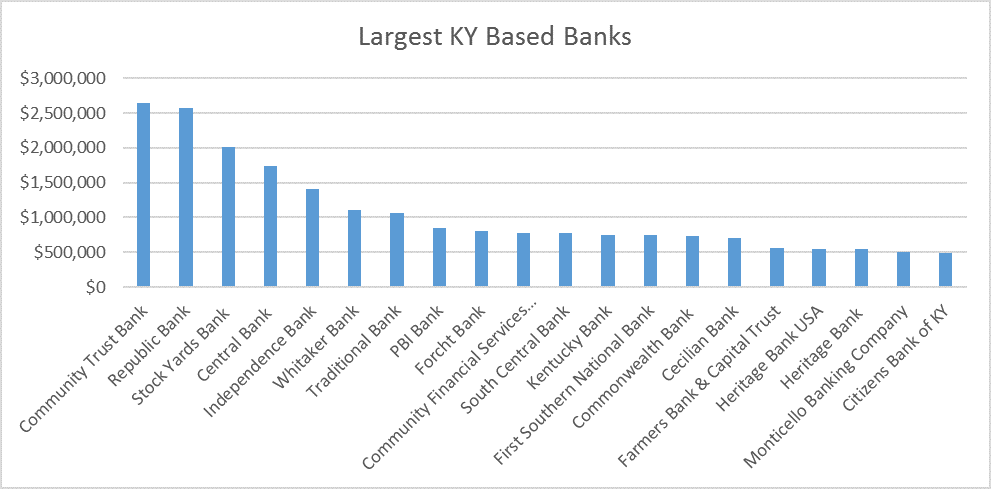
The top five banks in Kentucky control nearly $29 billion with 494 offices or 38% of the market. The top five banks are all headquartered out of state. The top 20 KY based banks control $21.3 billion with 420 offices or 28% of the market. The Top 20 KY Based Banks are indicated in the chart below.
The Top 5 Counties in terms of bank deposits are shown below. Jefferson County consistently leads the list with nearly one quarter of the state’s bank deposits. Interestingly enough, of the top 10 markets in the state, 30% are in the Central part of the state, 30% in the North, 30% in the West while 10% or one county, Pulaski County is in the Southern or South Central part of the state.
|
Largest Counties in Terms of Bank Deposits |
|||
|
County |
# of Offices |
$ Deposits |
Market Share |
|
Jefferson |
249 |
18,592,726 |
24.29% |
|
Fayette |
114 |
6,801,400 |
8.89% |
|
Daviess |
41 |
3,156,053 |
4.12% |
|
Kenton |
60 |
2,492,699 |
3.26% |
|
Boone |
54 |
2,332,808 |
3.05% |
|
Warren |
56 |
2,211,419 |
2.89% |
|
Hardin |
41 |
1,541,753 |
2.01% |
|
Campbell |
37 |
1,461,631 |
1.91% |
|
McCracken |
30 |
1,353,389 |
1.77% |
|
Pulaski |
30 |
1,123,547 |
1.47% |
The Top 5 KY Based Banks with the most in $Dollar Growth in 2016 are indicated in the chart below. The Cecilian Bank and First Southern were aided in growth by in state acquisitions.
|
Bank |
Area |
$ Growth |
|
Republic Bank |
Louisville |
309,970 |
|
Stock Yards Bank |
Louisville |
263,099 |
|
The Cecilian Bank |
Cecilia |
217,396 |
|
First Southern National Bank |
Stanford |
150,422 |
|
Community Trust Bank |
Pikeville |
129,488 |
The top 5 KY based banks in terms of % Percentage Growth were somewhat different. The Cecilian Bank, First Southern and Kentucky Bank all were aided positively in growth by an in state acquisition.
|
Top 5 in % Growth |
Area |
% Growth |
|
The Cecilian Bank |
Cecilia |
44.24% |
|
First Southern National Bank |
Stanford |
25.16% |
|
Heritage Bank |
Erlanger |
18.13% |
|
Kentucky Bank |
Paris |
16.49% |
|
Community Financial Services |
Benton |
15.67% |
In terms of geographical markets, the Louisville, Jefferson County market had more growth than the other top four counties combined with $863 million in deposit growth. The Bowling Green, Warren County market was second with $156 million in deposit growth with Fayette, Marshall and Campbell following closely behind.
|
Top 5 Counties for $ Growth |
Area |
$ Growth |
|
Jefferson |
Louisville |
863,404 |
|
Warren |
Bowling Green |
156,118 |
|
Fayette |
Lexington |
131,640 |
|
Marshall |
Benton |
115,440 |
|
Campbell |
Ft. Thomas |
112,236 |
The bottom 5 Counties in terms of growth in deposits are led by Daviess County, Owensboro area, with a decline in deposits totaling $543 million, however most of that decline was primarily attributed to one out of state bank located in the market.
|
Bottom 5 Counties for $ Growth |
Area |
$ Growth |
|
Daviess |
Owensboro |
-542,899 |
|
Powell |
Stanton |
-87,473 |
|
Simpson |
Franklin |
-65,272 |
|
Harrison |
Cynthiana |
-38,138 |
|
Hart |
Munfordville |
-35,010 |
|
|
|
|
The smallest county in terms of bank deposits is Robertson with $17.8 million in deposits and one banking office in the county.
The top SMSAs were led by the Northern KY -Cincinnati market which totals nearly $107 billion and had an extraordinary growth of $16.4 billion, in excess of 18% over the prior year. The unusual growth in the Cincinnati market was primarily attributed to US Bank who had an increase in deposits in that market of around $13 Billion of the $16.4 Billion overall growth. Assuming that data was an aberration and you discount that growth entirely, you would still have growth of around $3.4 billion or 3.8% growth.
The other markets indicating the strongest growth were the Louisville-Southern Indiana market followed by the Lexington area, the Evansville-Henderson market and the Huntington-Eastern KY market.
|
Largest Deposit Markets in Kentucky $ in Millions |
||||||
|
SMSA |
# Banks |
Deposits |
Offices |
$ Growth |
% Growth |
Avg. Office $ Size |
|
Cincinnati* |
67 |
106,806 |
752 |
16,439 |
18.19% |
142 |
|
Louisville |
40 |
25,223 |
416 |
1,093 |
4.53% |
61 |
|
Lexington |
37 |
9,396 |
183 |
270 |
2.96% |
51 |
|
Evansville |
23 |
5,568 |
99 |
134 |
2.47% |
56 |
|
Huntington |
29 |
5,528 |
128 |
86 |
1.58% |
43 |
In summary, Kentucky based Community Banks are solid deposit producers compared to their Super Regional counterparts. Even though the state has shown a decline in the number of banks and bank offices, deposit growth was healthy at 2.4% growth even though interest rates are at or near all time lows.
Nationally, the numbers of banks and the numbers of banking offices continues to decline as well. The number of banking institutions has been declining since 1985 and the number of banking offices has been declining since 2013. Merger activity and new banking technology will most likely continue to contribute to this decline.

Data Source: FDIC